Welcome to Crazy Egg!
54% of visitors leave your website without exploring a second page. Depending on your industry (B2B, eCommerce, SaaS) and the type of content you’re presenting (product pages, landing pages, blog articles), the number can jump as high as 90%. While traditional analytics tools can show you traffic metrics, Crazy Egg goes one step further and shows you exactly where potential customers are dropping off and why your website is not converting as effectively as it could.
That’s why over 300,000 websites have used Crazy Egg to improve their customer experience by understanding how and why over 10 billion visitors have made 30 billion unique decisions since 2005.
This 4-step guide will help you get the most out of your investment in Crazy Egg from Day 1, so you can make your website even more effective and impactful right out of the gate.
Step 1: Install Crazy Egg
Install Crazy Egg on your website, and the world’s first and most trusted tool for understanding audience behavior will be fully available. Since Crazy Egg recommendations are customized to your traffic and visitor behavior, you’ll need to install us on your website.
Installation takes 5 minutes. You can install Crazy Egg in three ways:
- Cut and Paste a Tracking Script
- Native Integrations
- Email a Developer
Log in to your account and click on “Install Crazy Egg” which can be found in the blue menu on the left-hand side of your dashboard. You will be presented with several options for installation, based on the design of your website. We cover scenarios ranging from Shopify to Drupal to WordPress, as well as how to use HTML for manual installations. For other installation guides, check out Crazy Egg various installation methods
Results usually appear within a few hours, but some sites could take up to a day if they receive low visitor traffic.
Crazy Egg starts analyzing your website and user behavior the moment it’s installed. However, the value you see and how quickly you see it ultimately depend on the volume of people visiting your website and the plan you select.
Step 2: Create your First Snapshot
You can’t fix what you don’t know is broken. Snapshots are the fastest way to understand how your visitors behave on a given page. They help you identify where to focus your attention to make the most significant impact.
In a few short clicks, you can Create Your First Snapshot. Once created, the snapshot status will be “Running.” As soon as you have one visit tracked, your Snapshot Reports will become available.
Crazy Egg Snapshots provide seven different reports to help you answer your questions. The reports are Heatmap, Scrollmap, Confetti, Overlay, List, Page Performance, and Total Errors.
Step 3: Explore Visitor Recordings
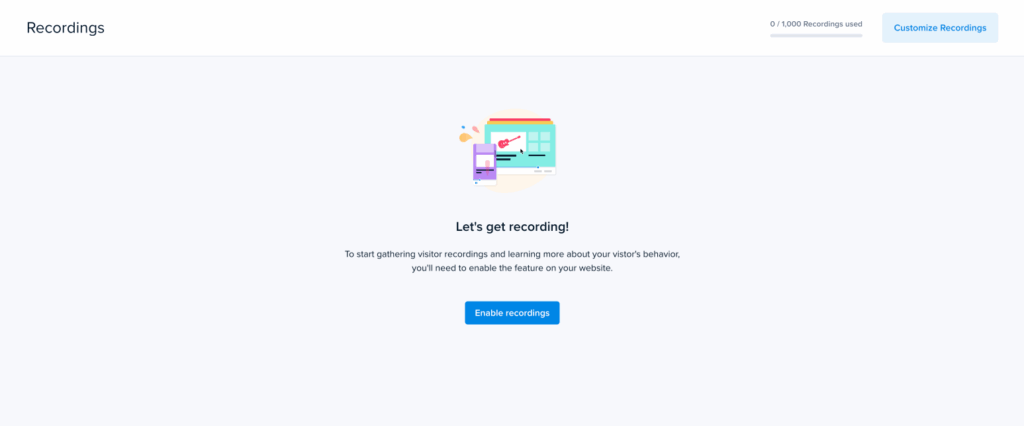
Now that you have a clearer idea of how visitors are reacting to your site, it’s time to dive even deeper with Recordings. User Recordings let you see what your website visitors are doing in real-time, almost as if you had a seat next to them. You’ll be able to see the immediate impact of product launches and even understand the exact moments that potential customers are stalling.
To get started, navigate to your Recordings dashboard and click on Enable Recordings.
To learn more about Recordings and how to record specific pages, check out Start Recording Specific Pages and URLs.
Step 4: Implement Your Own A/B Test – No Code Necessary
The next step to increasing your conversions and landing those sales is to start A/B Testing. Armed with visual knowledge from your Snapshots and real-world user research, it’s important to test which changes will make the most impact on your audience. The great news is that you don’t need to be a developer to implement your own A/B tests – we’ll guide you through the whole process!
First, navigate over to your A/B Testing dashboard, which you can find in the blue menu located on the left-hand side, and then click Create an A/B Test.
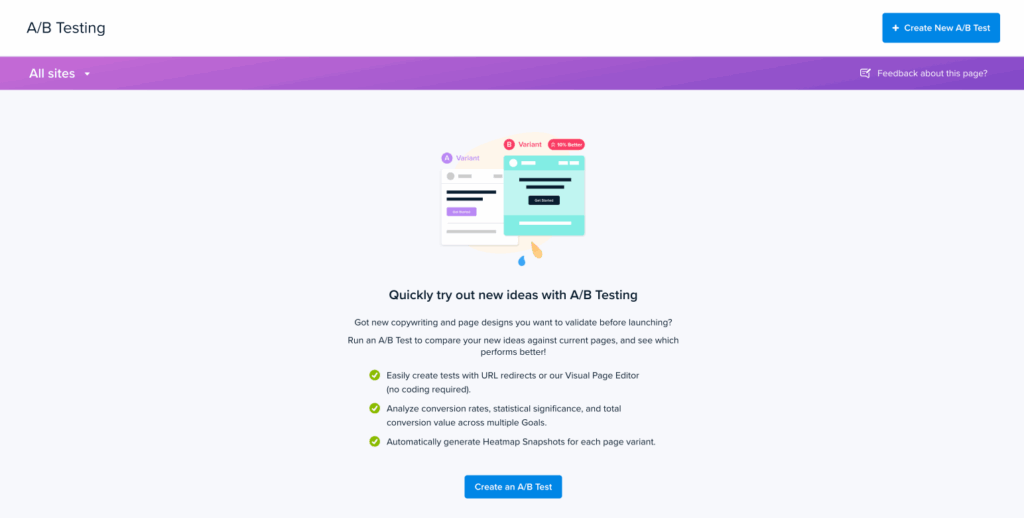
Now you’ll be able to choose which page you’d like to improve, the tweaks you’d like to test against the control page, and also the goal that you’re aiming to accomplish.
The value of Crazy Egg is that not only can you identify areas of opportunity on your website, but you can also find more effective ways of surfacing valuable information to your audience. Welcome aboard and happy testing!
The value of Crazy Egg is that not only can you identify areas of opportunity on your website, but you can also find more effective ways of surfacing valuable information to your audience. Welcome aboard and happy testing!