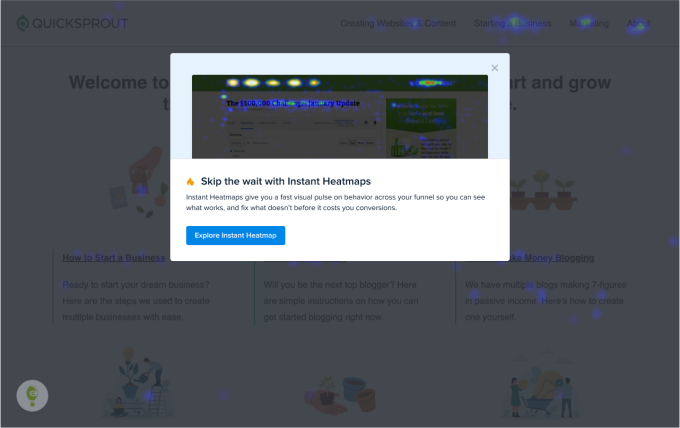
Instant Heatmaps give you a fast, lightweight view of how people click on your website — without needing to set up a Instant Heatmaps Overview first. They’re designed to help you quickly see patterns, spot interesting behavior, and find pages that may need deeper analysis.
Instant Heatmaps use Web Analytics sessions to generate a simple clickmap preview. If you need full reporting, historical data, audience filters, device views, or exportable heatmaps, you can create a full Instant Heatmaps Overview (Heatmap Report) at any time.
What Instant Heatmaps Show
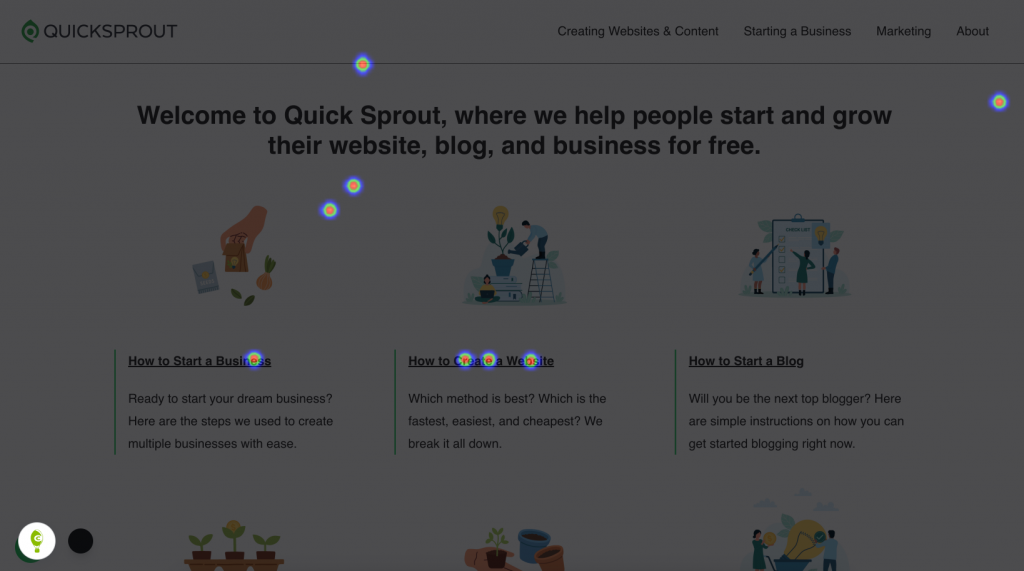
Instant Heatmaps automatically generate heatmaps for the last 30 days of traffic on every page. Instead of waiting for a manually created Instant Heatmaps Overview to gather data, you get an immediate visual readout of where people clicked most.
Instant Heatmaps are designed to show:
- High-level click activity
- Page-specific engagement patterns
- Areas worth deeper exploration
They are intentionally simple and lightweight — they’re a preview, not a full Instant Heatmaps Overview report.
How Instant Heatmaps Differ from Heatmaps
Instant Heatmaps:
- Use Web Analytics data
- Update quickly and require no setup
- Provide a basic clickmap view only
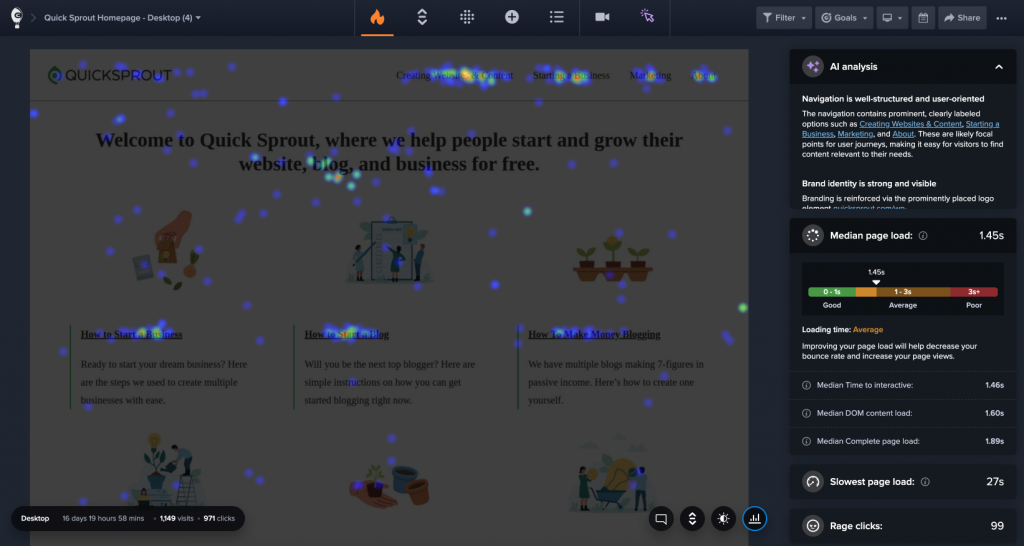
Heatmaps (Heatmap Reports)
- Capture full, unsampled datasets
- Include multiple heatmap types (Click, Scroll, Confetti, Overlay, List)
- Support device segmentation, date ranges, and advanced filters
- Allow exporting, team collaboration, and combining page variants
- Include AI Analysis for deeper insights
Instant Heatmaps = fast, automatic, and free
Heatmaps = full analysis, historical depth, advanced tooling
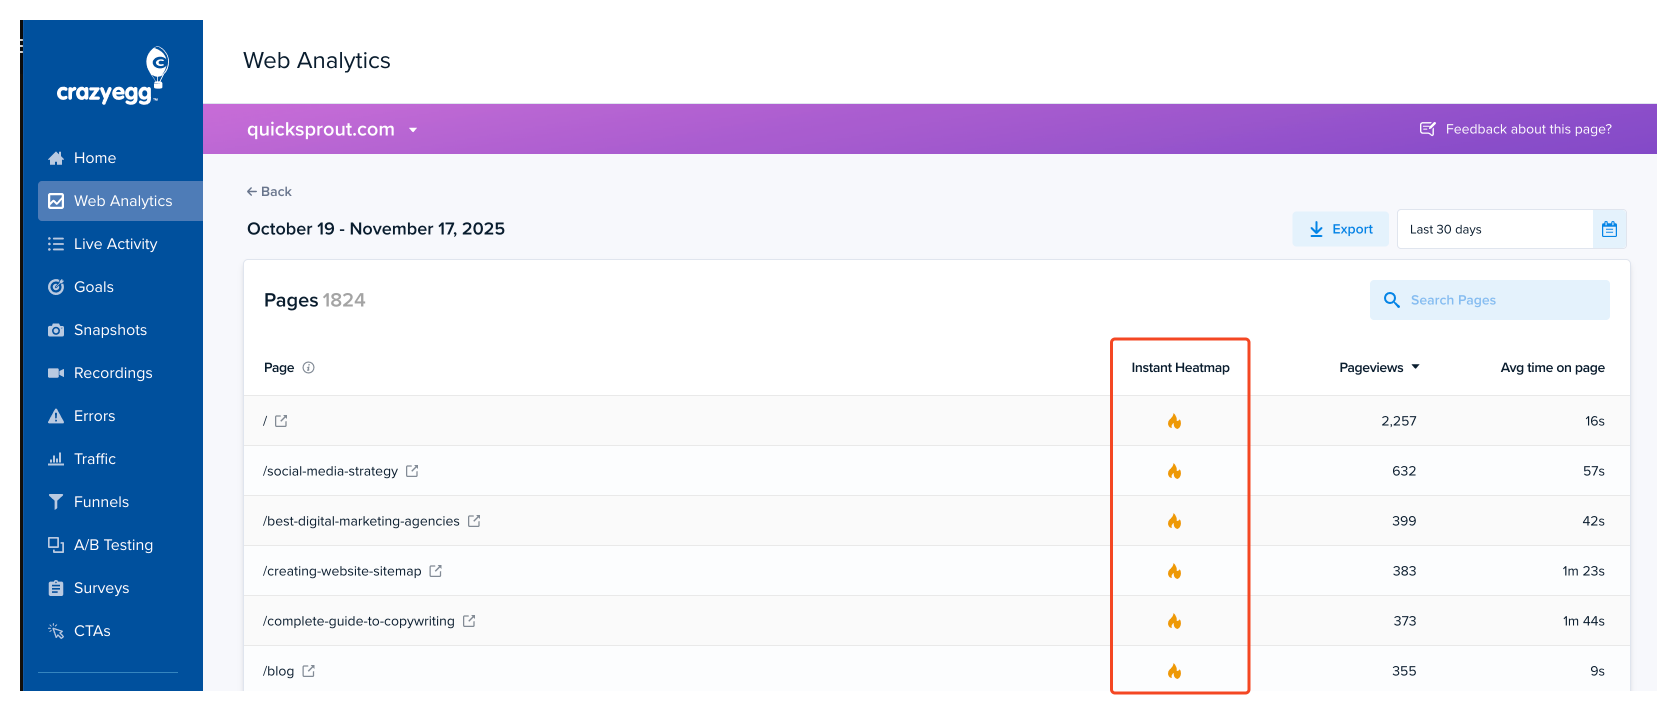
Where to Find Instant Heatmaps
You can open an Instant Heatmap anywhere you see click data within Web Analytics:
- Web Analytics Dashboard
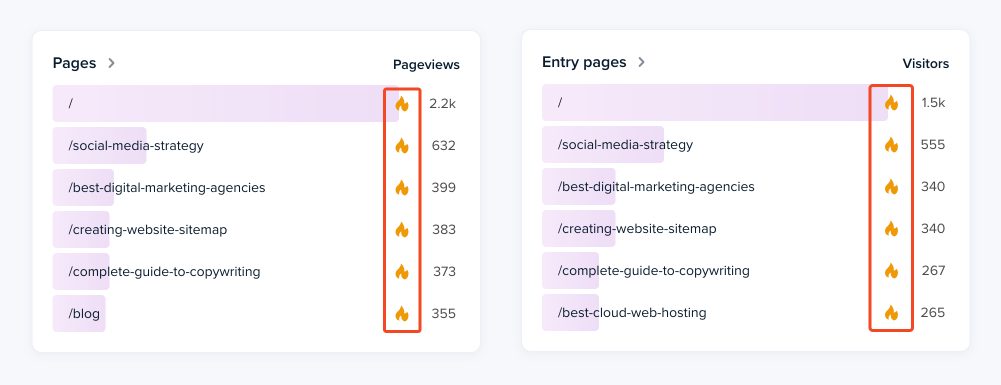
- Web Analytics Page Detail View
Limitations
To stay fast and lightweight, Instant Heatmaps include only a subset of the full Heatmap capabilities:
- Sampled sessions only
- Clickmap only (no Scrollmap, Confetti, Overlay, or List)
- Limited device segmentation
- No date filtering
- No audience filters
- No collaboration tools (sharing, comments)
- Not exportable
- Not available for every page type
- Data limits: up to 1,000 sessions/day and 10,000 clicks per page
When to Use a Full Heatmap Instead
Use a full Heatmap when you need:
- Complete, unsampled traffic data
- Device comparisons (desktop, tablet, mobile)
- Scrollmap, Confetti, Overlay, or List Views
- Element-level click metrics
- Exportable reports
- Segmentation by audience, traffic source, or conversion
- AI Analysis to find patterns
- Permanent reports to reference or share with your team
Instant Heatmaps are great for quick answers. Heatmaps are built for deep analysis.