Setting up Heatmaps and Session Recordings for your A/B Test ensures you can track user engagement and compare conversion rates between your control and variant(s). Crazy Egg provides heatmaps and session recordings, making it easier to see the metrics coming from variants and analyze performance differences. Whether your A/B Test is created using Crazy Egg’s Page Editor or URL Redirect, this guide will walk you through the setup process.
Following this guide, you can track user interactions, analyze conversion rates, and optimize your A/B Test results using Crazy Egg’s Heatmaps and Session Recordings.
Setting Up Heatmaps & Recordings
If Your A/B Test is Created Using the Page Editor
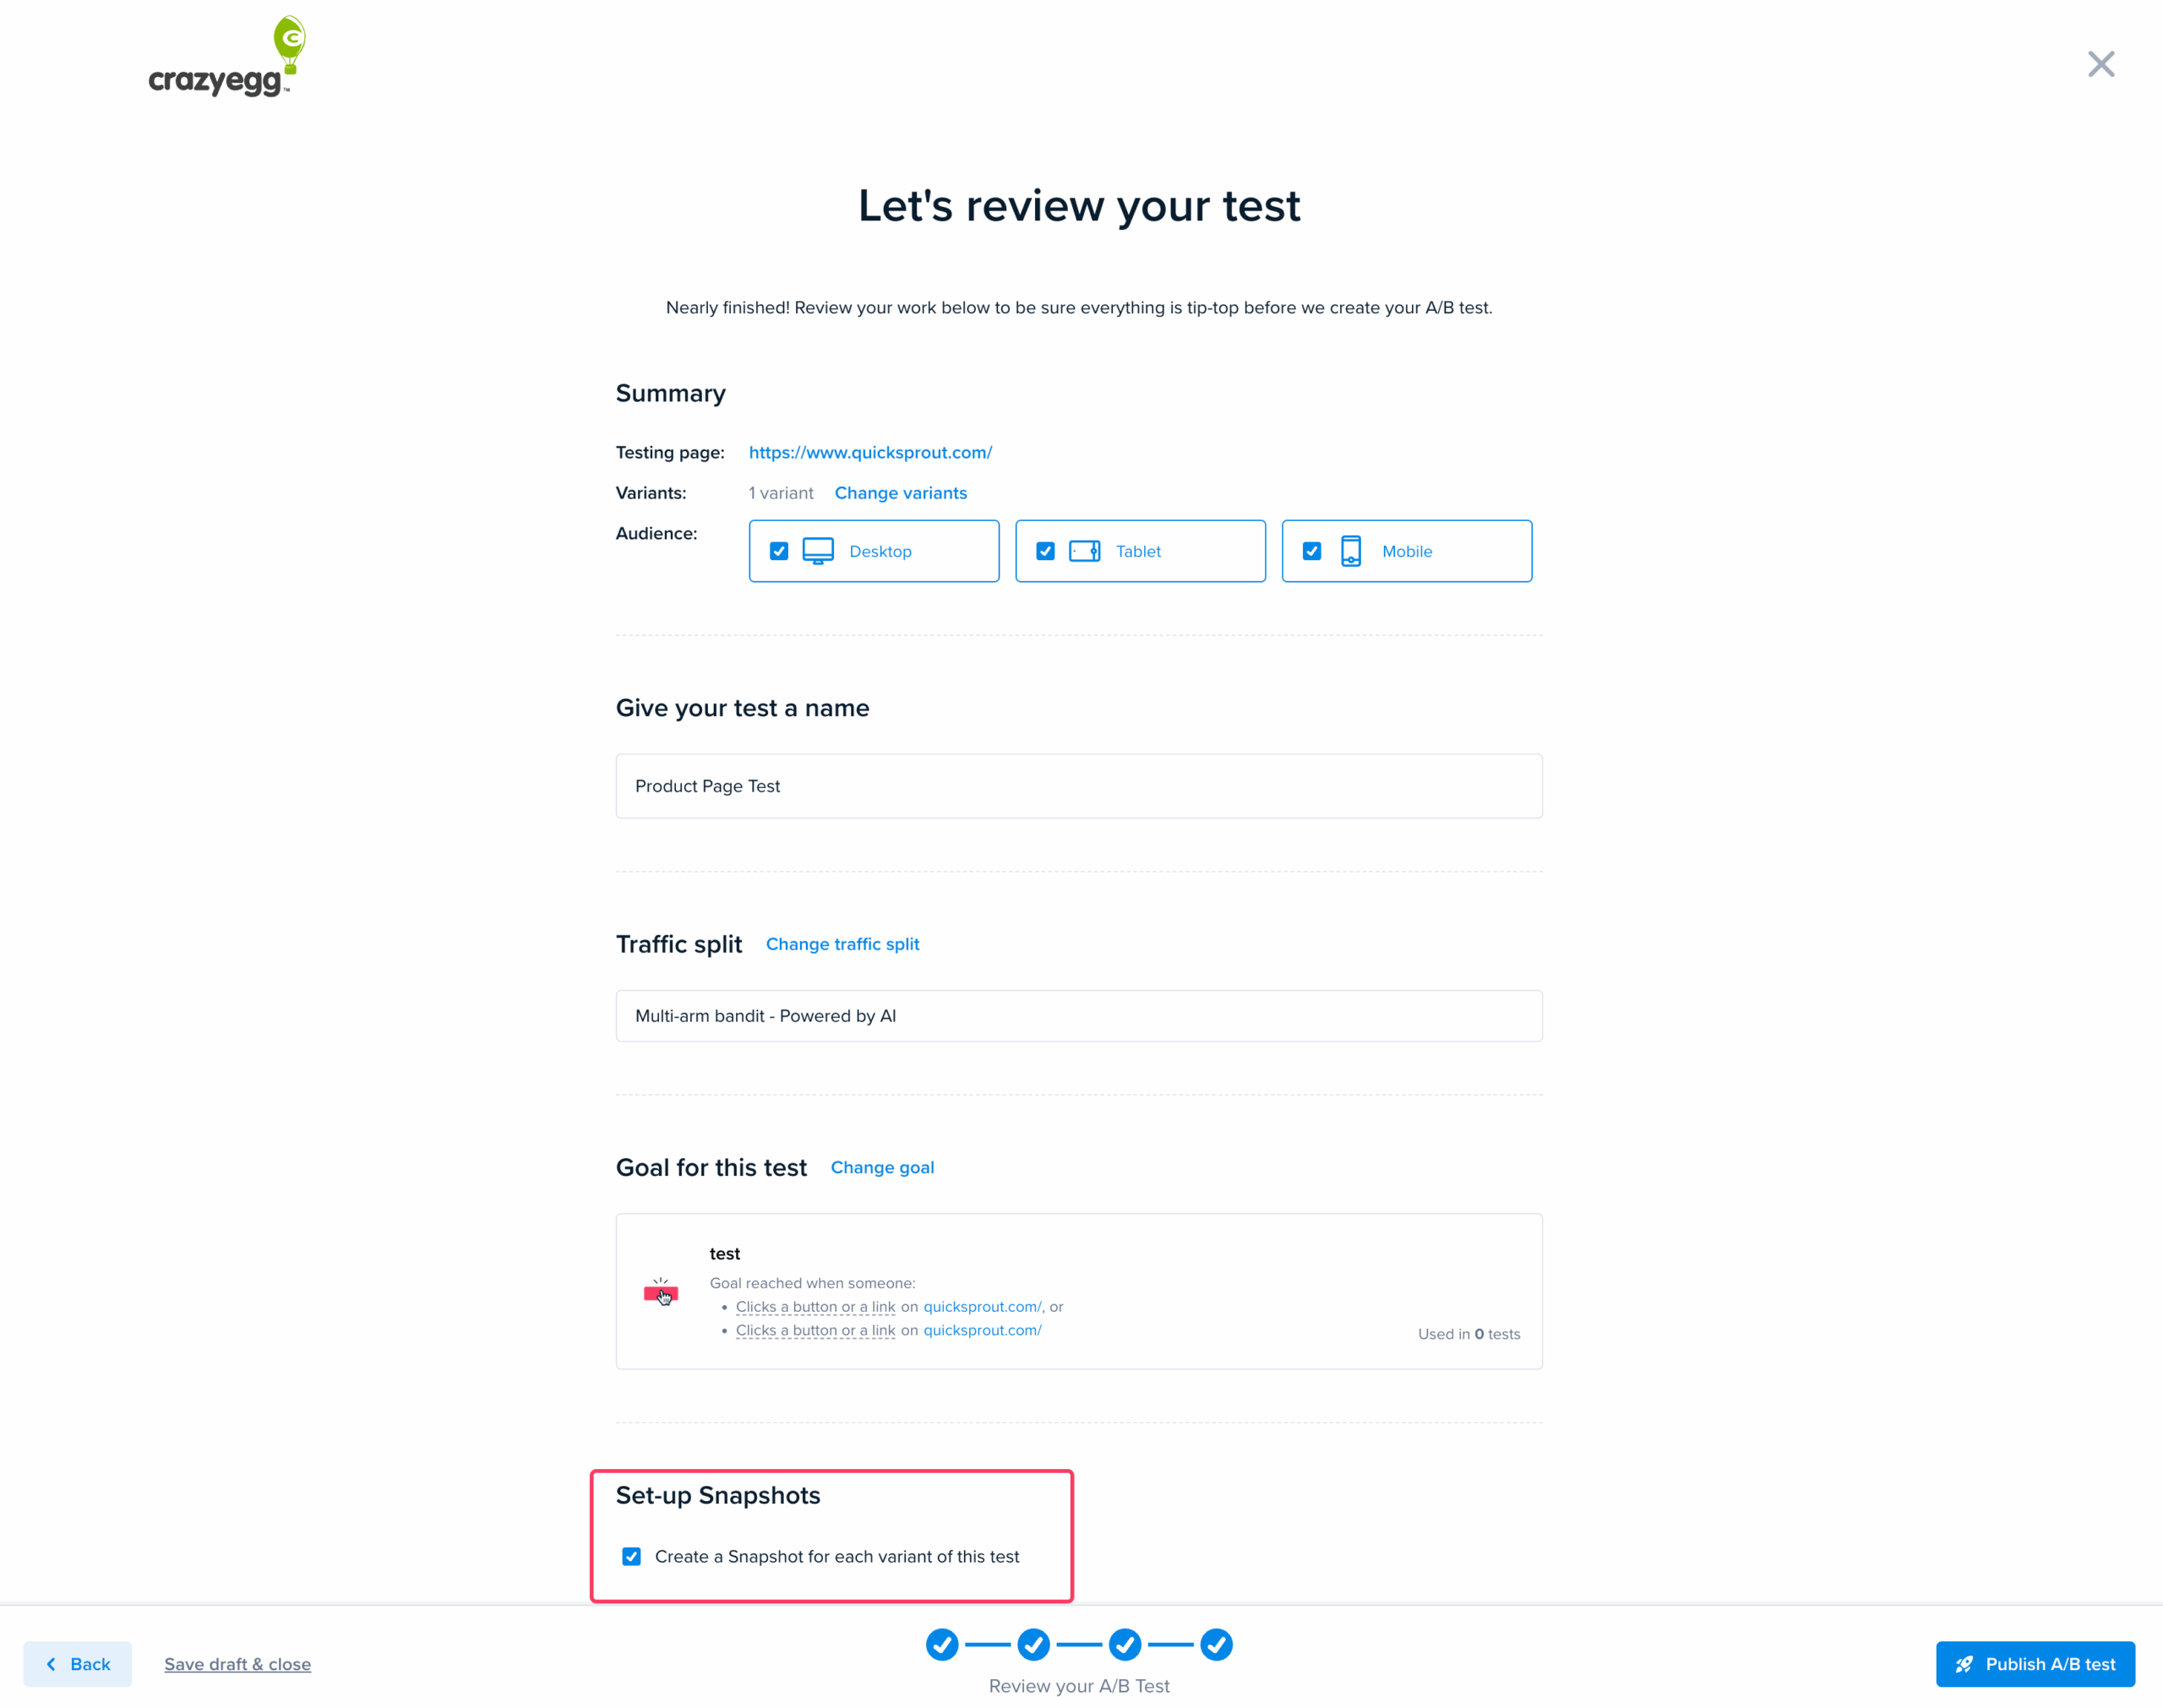
When you create an A/B Test using Crazy Egg’s Page Editor, the tool automatically generates heatmaps and session recordings for both the control and variant(s). This allows you to compare user engagement and conversion rates effortlessly.
By default, a checkmark is placed here (on the Review page for your A/B test). Please ensure you do not remove it.
Once your test runs, you can view each version’s results, heatmaps, and recordings. See Accessing Heatmaps & Recordings in the A/B Testing Results Report.
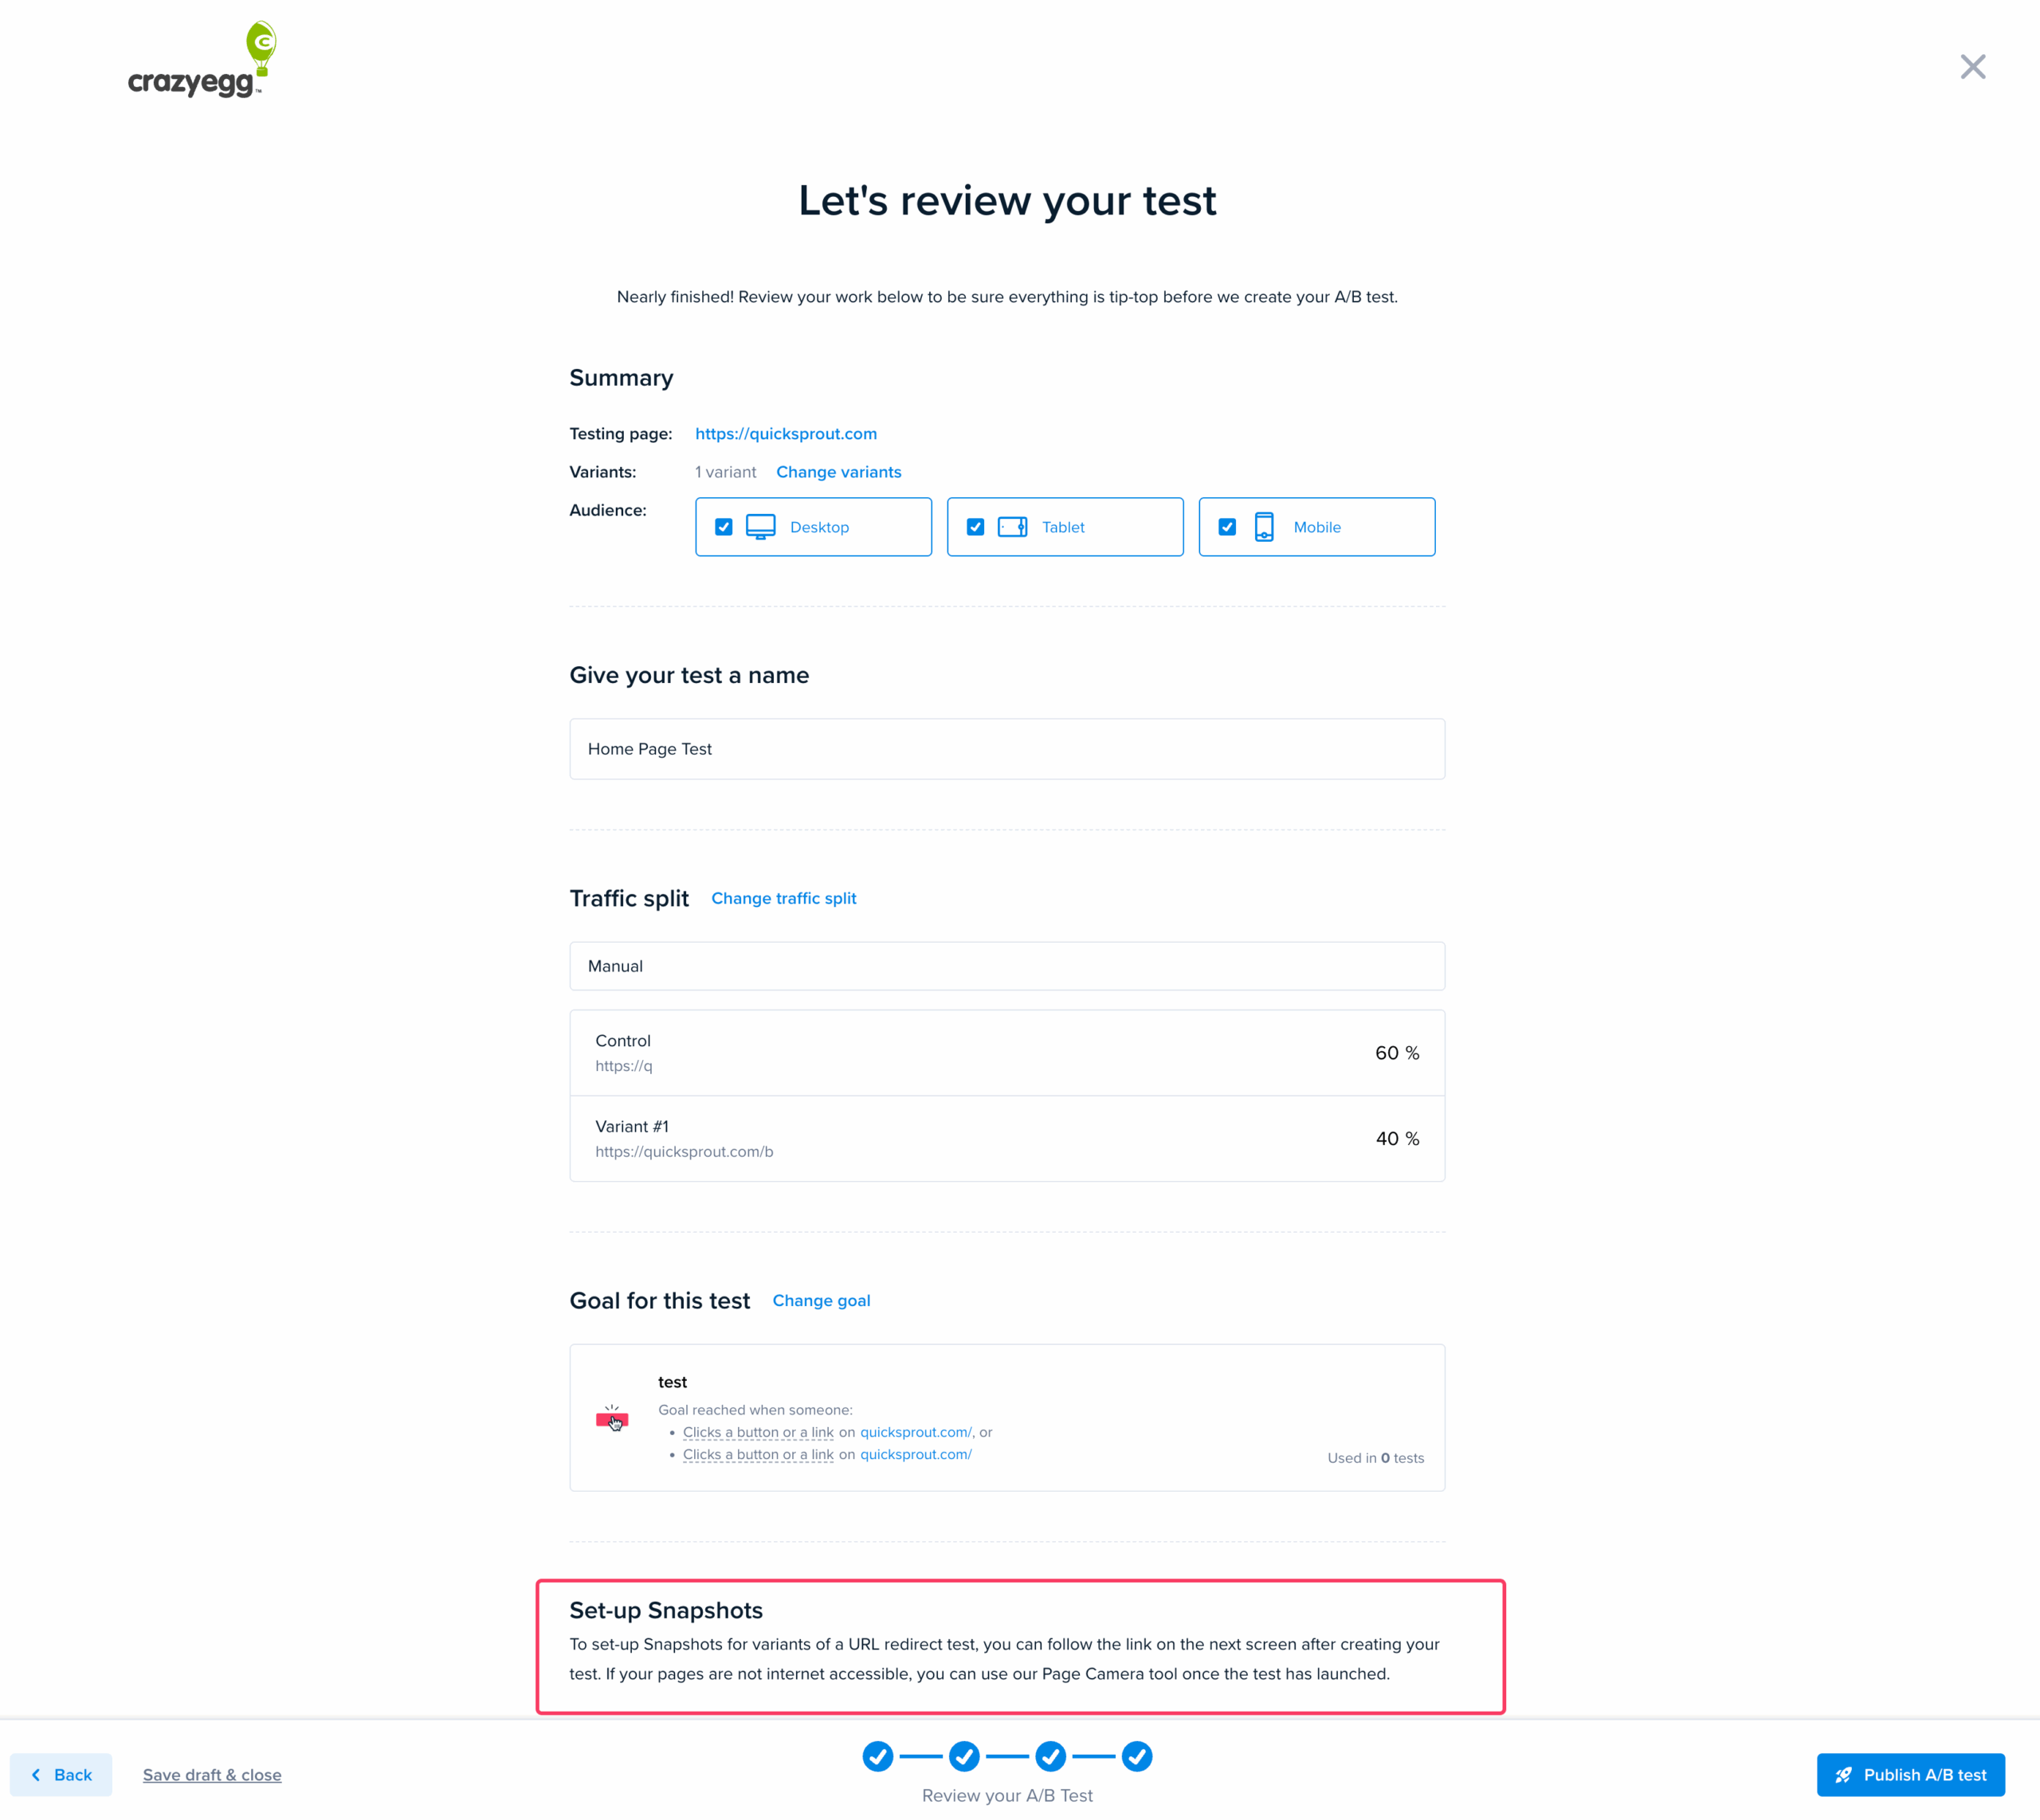
If Your A/B Test is Created Using URL Redirect
For A/B Tests created using a URL Redirect, you must set up separate Heatmaps for the control and variant URLs.
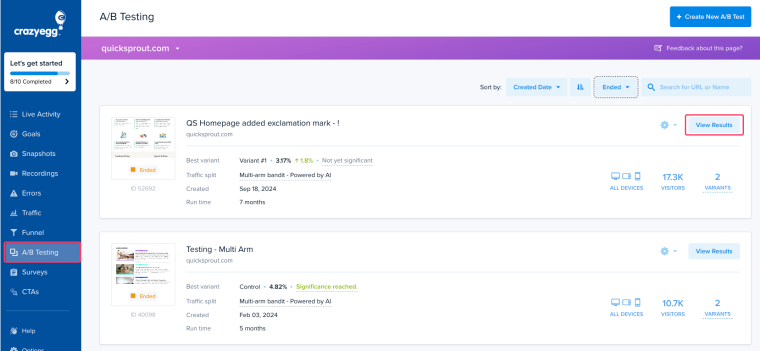
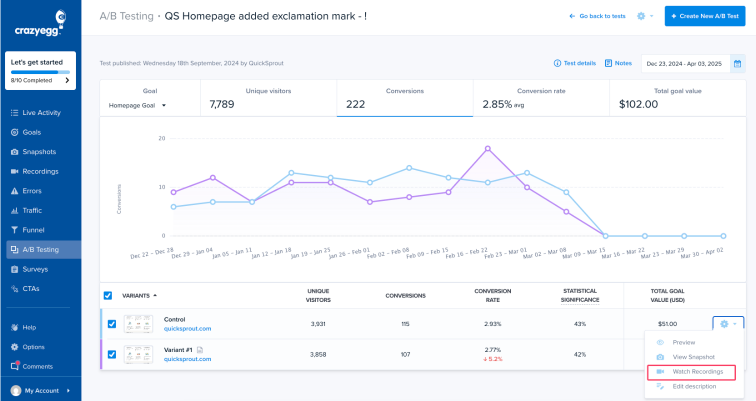
Accessing Heatmaps & Recordings in the A/B Testing Results Report
Once your test has run, you can analyze the collected data:

When Will Data Be Available?
- Heatmaps and session recordings start collecting data after the test is live.
- Depending on traffic, you may begin seeing data within a few hours.
- To get meaningful insights, allow the test to run long enough to capture user behavior trends.