Ardeaux Media knows the importance of establishing a baseline before jumping in. So, when Drive-A-Logue came to them wanting to increase their online sales and drive brand awareness, Ardeaux knew just where to start and how.
THE CHALLENGE
As a small online store, receiving just over 100 visits per month, Drive-A-Logue had to make the most of every visit and Customer Acquisition Cost (CAC). But with no baseline information on how well their website was performing, this would be a difficult task. Upon taking them on as a client, Ardeaux Media set to work on establishing this much-needed baseline.
After all, you cannot fix what you don’t know or understand.
“Before Crazy Egg, we only had a few pieces of the puzzle, which included analytics on conversions, demographics, and sources. Since then, we now see the whole picture of how visitors interact
with websites and make informed decisions on how to improve them.”
THE SOLUTION
Crazy Egg does not just track data. Crazy Egg makes it easy to interpret your visitors’ actions by showing you what visitors are doing on your site. From Snapshots and the 5 visual reports contained within User Journey Recordings, you will be able to see and understand what is happening on your site.
Snapshots are the fastest way to get an in-depth understanding of how your visitors are behaving on a given page(s). They help you identify where to focus your attention to make the biggest impact.
Looking for patterns on the Heatmap and Scrollmap report will give you a good idea of distracting your visitors. Are visitors interested in the material you are presenting (even a small %), and if so, what might you do to entice more visitors down the page?
The List Report can help answer questions such as what is causing your page to have a high exit rate. Or drill down on your page’s most popular elements using the Overlay Report to find out who is clicking on your Call-to-Action (CTA’s) buttons. Or find out just how popular those dead space clicks are and if you should make them clickable. The Confetti Report (an aggregation of all the clicks on your page) will roll everything up for you and let you gain a great insight into your visitor profile and where they are coming from.
There is a wealth of insight you can gain from these visual reports. And then there are User Journey Recordings.
Recordings let you see a sampling of individual visitors as they journey across your page. Look for lots of scrolling, or rapid clicks, or short duration and no movement. All of these will point you to things causing distractions for your visitors. Frustrations. And help you ask the question of what can you do to improve your site? What can you do to improve your visitors’ experience?
THE FINDINGS & BENEFITS with Crazy Egg
The first two weeks were focused on collecting as much data as possible about the original website. To collect this data, Google Analytics and Crazy Egg Snapshots and Recordings were set up. Google Analytics and Crazy Egg are used together to paint the fullest picture of what is happening across your website.
To speed up the collection process and find out what was happening on the site, Facebook and Instagram Ads were established to drive more visitors to the site in a short period of time.
With data now collected, it was soon discovered that Drive-A-Logue had a 95% exit rate coupled with a 97% bounce rate.

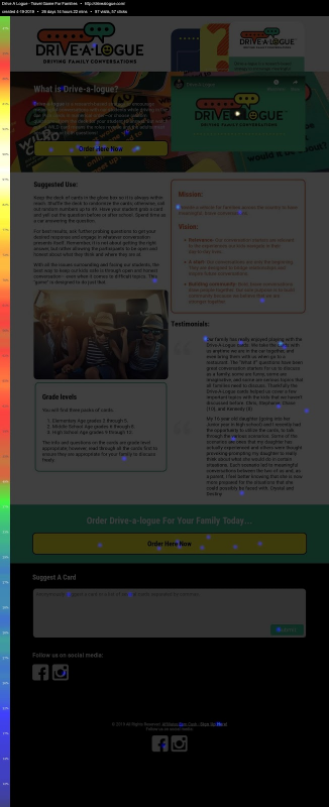
After watching several Crazy Egg User Recordings, Ardeaux discovered visitors landing on the page were having trouble with the page loading or left the page open for an extended period with no activity.
The Snapshot reports (particularly the Overlay Report) lead to discovering a pattern of clicking attempts on non-clickable material. These two factors played a major role in the premature loss of visitors.
Using the Scrollmap report, Ardeaux Media could see and show their client that several visitors on the site were not scrolling past the first-page fold, meaning users could not reach vital information on the product that would cause them to purchase their product.

Making Meaningful Changes
With a baseline now established and an understanding of what was happening, Ardeaux started to make changes to Drive-A-Logue’s website with these important insights.
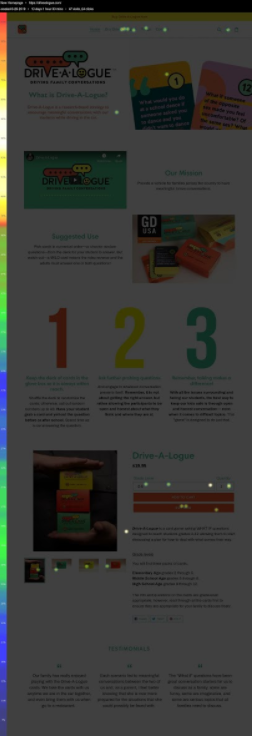
A key difference when comparing the redesigned website’s Heatmap to the original Heatmap is that every click landed on a clickable part of the website. This improves visitor retention and indicates that the design is intuitive, which creates a better environment for sales. The most clicked links on the homepage are now the “Buy Drive-A-Logue” at the top, grade level options on the product, and the “Buy Now” button.

As we saw in the first Heatmap, the visitors’ time was mainly spent on the first fold on the page.
In doing this, the visitors missed out on key information about Drive-A-Logue, much of which might have moved them to make a purchase. This updated report shows that the visitors’ time is concentrated in different parts of the page. This indicates slow scrolling through the page, which we can interpret as the visitor reading the page’s product information. Once visitors arrived at the product, fewer than 20% of visitors continued to the page’s bottom.
The RESULTS
When analyzing Google Analytics, we can see that the exit rate decreased by over 40%, indicating that the visitors stayed longer to absorb the information on the website. The bounce rate also decreased around 20%, which indicates that the new website was capturing the audience’s attention.

Considering the higher volume of visitors from the ads, sales grew in likelihood and resulted in $178.39 in sales.

“Not only has Crazy Egg given us concrete evidence of the visitors’ actions on the websites, but it has also helped us make the users’ experience more intuitive. Before Crazy Egg, we had only a few puzzle pieces, which included analytics on conversions, demographics, and sources. Since then, we now see the whole picture of how visitors interact with the websites and make informed decisions on how to make them better.”