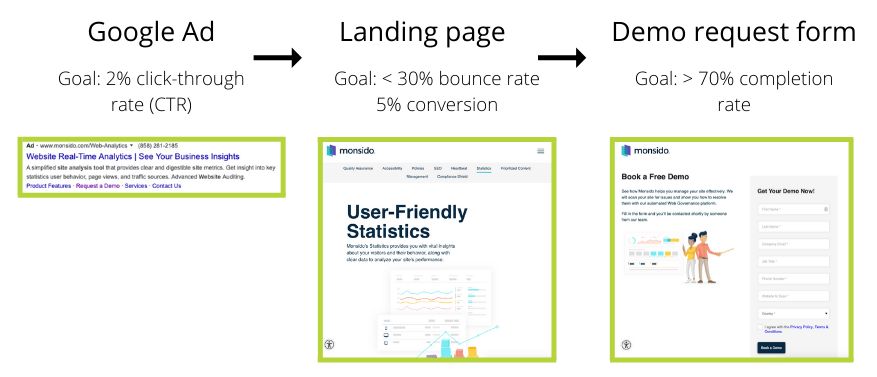
We are often asked how do you conduct a Web analysis using Crazy Egg? Or I have all of this data; how is Crazy Egg going to help us with a Website analysis? The answer is simple; Crazy Egg can highlight pain points visually for you. Combining your Google (or Adobe) Analytics data with Crazy Egg will give you the complete picture.
First, conducting a website analysis is more of a process rather than straight data collection. You want to be able to do the following:
- Map out your ideal journey
- Set your intention and goal
- Measure what’s happening
- Brainstorm causes and solutions
Then, test and iterate until you’ve dialed in on the results that you are after. From here, we begin all of our Professional Service analysis and recommend it to all of our customers. See our Case Studies for live examples.
Step 1: Map Out Your Ideal Website Journey
No matter what aspect of your website you’re looking at, having a baseline or ideal scenario to compare your results is the key to resolving issues on your site. That’s why this step is the most important—mapping out the perfect website journey you want visitors to follow—from the first step (Google search results, for example) to the last (filling out a demo request form on a landing page, for example).

But remember, it is not always about the big picture. Mapping out the journey between each page to drive visitors down your sales funnel, sign-up funnel, or reach your overall website goal is essential to do; however, mapping the micro user journey on the individual pages is equally vital.
Once you know the intended journey and actions you wanted your visitors to take. Defining the reason for your analysis will be easier.
Step 2: Setting Your Analysis Goal
Starting with a clear understanding of why you’re running an analysis of your website will help focus your study. This understanding will help you know which Snapshot reports to review or which filters (playlists) to create in your recordings.
Below is a simple framework we use every time we conduct Professional Services consults with customers. To help focus the analysis.
We are doing _____
Because we see the problem of _____
Once you know what your ideal journey looks like and see your analysis’s intention, you can start to breakdown your data and find out what’s causing the disconnect.
Step 3: See What’s Happening with Snapshots and Recordings
Remember, back in step 2; you stated you would focus your analysis on a particular problem. Now’s the time to identify and confirm the problem. To answer the next set of statements in our simple framework:
We know it’s a problem because _____
If we don’t fix it, we’ll see _____
The six snapshot reports will provide you with a detailed view of what visitors are doing (and not doing) on your pages that make up your visitor journey. Studying the reports will provide you with insights on what is happening and what is not happening on your pages (and site).
Video recordings will aid in your analysis by understanding problem areas and what the standard user journey is for your visitors starting on a given page.
For more information on analysis with Snapshots and Video Recordings, check out each respective section in our Help Center.
Step 4: Compare the Reality to Your Ideal and Brainstorm Causes and Solutions
The final step is to figure out why there are discrepancies between these two (assuming there are) and how you can fix them to bring the actual situation closer to your ideal. The snapshot reports will cause you to wonder “why.” It’s the why wonderment that will take you into your video recordings to learn more. And even take you to look further into your Google (or Adobe) analytics.
All of this information will help you brainstorm ideas around the potential causes and solutions. Once you have the possible solutions, it’s time to implement those changes and continue monitoring your website and answer the final statement in our simple framework “We’ll know we’ve fixed it when we get _____.”
Website analysis is not a one-time activity. The best results come from continuously monitoring and actively making data decision-based changes. If you would like additional help, check out our Professional Service packages and/or our Case Study section for ideas and approaches.