A/B testing is a powerful way to optimize your website by comparing two versions of a page to determine which performs better. This article explains how to read and understand the results view of an A/B test in Crazy Egg.
Once you’ve published your A/B test, go to the A/B Testing Dashboard and click View the Results to check the conversions met and the performance of your ideas.
Overview of the Results Screen
When you open the results of an A/B test, you’ll see an overview that includes:
- Conversion: The specific action being measured (e.g., conversions, clicks).
- Unique Visitors: The total number of visitors included in the test.
- Conversions: The number of times the conversion was completed.
- Conversion Rate: The percentage of visitors who completed the conversion.
- Total conversion Value: The total monetary value of the conversion (if assigned).
Results Graph
The line graph shows daily conversion trends for each variant.
- X-axis: Test duration (e.g., Nov 10 – Dec 9).
- Y-axis: Number of conversions per day.
- Each line represents a test variant:
- Control (baseline) is often displayed in one color.
- Variant(s) appear in a different color.
How to Analyze Trends
- Look for significant differences in conversion spikes and overall patterns.
- Consistency over time indicates reliable results.
Variants Table
Below the graph, the table breaks down key metrics for each variant:
| Column | Explanation |
|---|---|
| Unique Visitors | Total number of visitors who saw each version of the page. |
| Conversions | Number of users who completed the conversion. |
| Conversion Rate | Percentage of visitors who converted. |
| Statistical Significance | The likelihood that the results are not due to random chance. |
| Total conversion Value | If a monetary value is assigned, this shows the revenue or value generated. |
Key Metrics to Compare
- Conversion Rate: A higher rate indicates a better-performing variant.
- Statistical Significance: For reliable results, aim for significance above 95%.
- Total conversion Value: Helps prioritize the winning variant based on the value it generates.
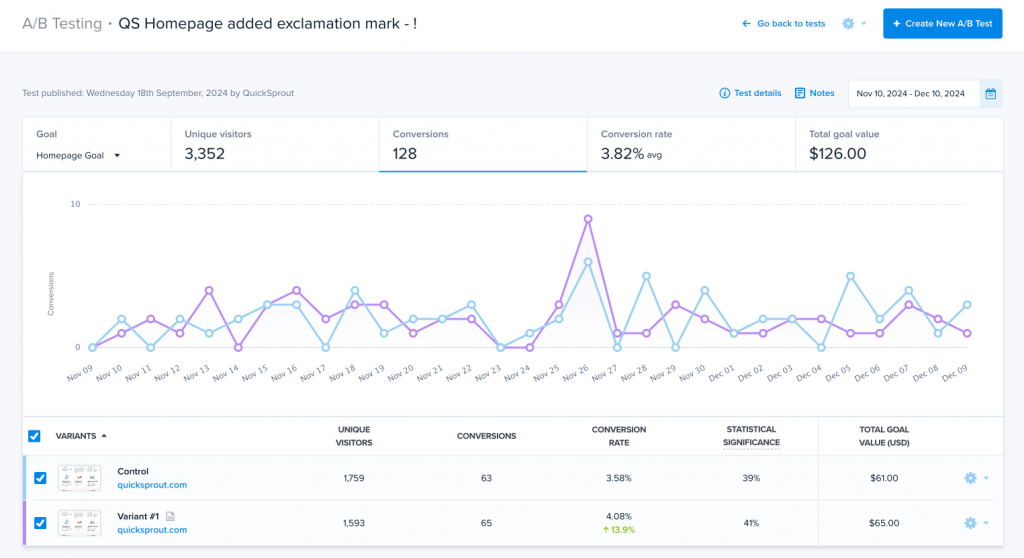
Example Breakdown
In the image above:
- Control (quickspout.com):
- Conversion Rate: 3.58%
- Conversions: 63
- Total conversion Value: $61
- Variant #1:
- Conversion Rate: 4.08% (↑ 13.9% improvement)
- Conversions: 65
- Total conversion Value: $65
Even with a small increase in conversions, Variant #1 shows a 13.9% improvement in conversion rate and slightly higher conversion value.
What to Do Next
- Check Statistical Significance: If results are significant, consider implementing the winning variant.
- Monitor Long-Term Results: Sometimes, short-term trends can shift.
- Document Learnings: Understand what changes impacted performance (e.g., wording, design tweaks).
FAQs
Q: What if the results are not statistically significant?
A: Extend the test duration or analyze for additional data trends.
Q: How do I know which variant is “winning”?
A: Compare the conversion rates and conversion values—look for the one with higher metrics and significance.
Conclusion
Interpreting A/B test results is essential for data-driven decision-making. By understanding metrics like conversion rate, statistical significance, and conversion value, you can confidently identify which page variation delivers better results.