Crazy Egg Page Speed helps you monitor the performance and overall health of important pages on your website.
Page Speed regularly analyzes your pages on desktop and mobile, tracks changes over time, and identifies opportunities to improve performance, accessibility, SEO, best practices, and compatibility with AI agents.
Page Speed is powered by Google Lighthouse and presents its audit results in a simpler report with ongoing monitoring, prioritized recommendations, and, when available, AI-generated guidance.
Add a page to Page Speed
To start monitoring a page:
The URL must belong to the selected site. For example, if you select example.com, you can monitor pages such as:
example.com/pricingexample.com/contactshop.example.com
When you add a new site to Crazy Egg, its homepage may already be added to Page Speed automatically.
After adding a page, Crazy Egg queues an initial desktop and mobile audit.
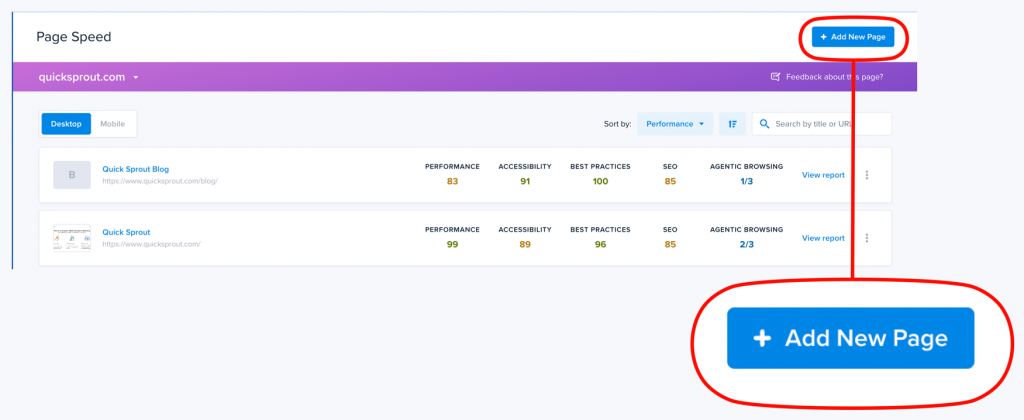
Understand the Page Speed dashboard
The Page Speed dashboard shows all pages currently being monitored for the selected site.
Use the Desktop and Mobile controls to switch between results for each device type.
For each page, Crazy Egg displays the latest results for:
- Performance: How quickly the page loads and becomes usable.
- Accessibility: Checks for issues that may affect visitors using assistive technologies.
- Best Practices: Checks for modern web development, browser, and security practices.
- SEO: Checks that help search engines understand and crawl the page.
- Agentic Browsing: Checks that help determine whether AI agents can reliably understand and interact with the page.
By default, pages are sorted by their lowest Performance scores so you can quickly identify pages that may need attention.
You can also:
- Search by page title or URL.
- Sort by score.
- Sort by page name or URL.
- Sort by creation date.
- Sort by latest audit date.
Understand your scores
Performance, Accessibility, Best Practices, and SEO are scored from 0 to 100.
- 90–100 — Good: The page performs well in this area.
- 50–89 — Needs improvement: There are opportunities to improve.
- 0–49 — Poor: The page has substantial room for improvement.
Desktop and mobile scores may differ because Lighthouse tests them under different simulated device and network conditions.
Mobile Performance scores are often lower because the mobile audit simulates a less powerful device and a slower network connection.
Agentic Browsing
Agentic Browsing is displayed as the number of checks passed rather than as a score out of 100.
For example, 3/4 means that the page passed three of the four Agentic Browsing checks.
View a detailed Page Speed report
Click View report next to any monitored page to open its detailed report.
The report includes:
- The latest audit status.
- The date of the last audit.
- The next scheduled check.
- Desktop and mobile results.
- Category scores.
- Performance metrics.
- Top recommendations.
- Complete Lighthouse audit results.
- Previous audit history and score changes.
- An AI-generated summary of recommended improvements, when available.
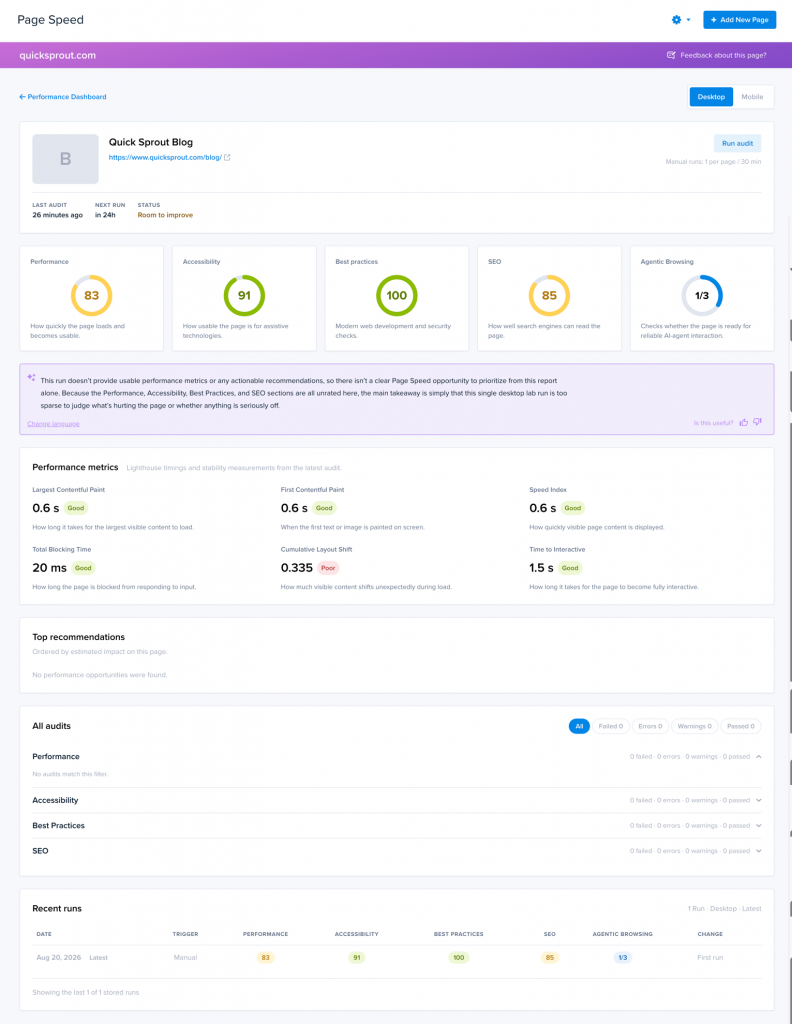
Understand the performance metrics
The Performance section includes Lighthouse measurements that help explain how visitors experience the page while it loads.
Largest Contentful Paint (LCP)
Measures how long it takes for the largest visible content element to appear.
A lower LCP generally means visitors see the page’s primary content sooner.
First Contentful Paint (FCP)
Measures how long it takes before the browser displays the first piece of page content, such as text or an image.
Speed Index
Measures how quickly the visible contents of the page are displayed while the page loads.
Total Blocking Time (TBT)
Measures how long the browser is blocked by long-running tasks and unable to respond to visitor input.
Cumulative Layout Shift (CLS)
Measures unexpected movement of page elements while the page is loading.
A high CLS can result in content, buttons, or links shifting position after a visitor starts interacting with the page.
Time to Interactive (TTI)
Measures how long it takes before the page becomes fully interactive.
Each metric is categorized as Good, Fair, or Poor, making it easier to identify areas with the most room for improvement.
Use recommendations to improve your page
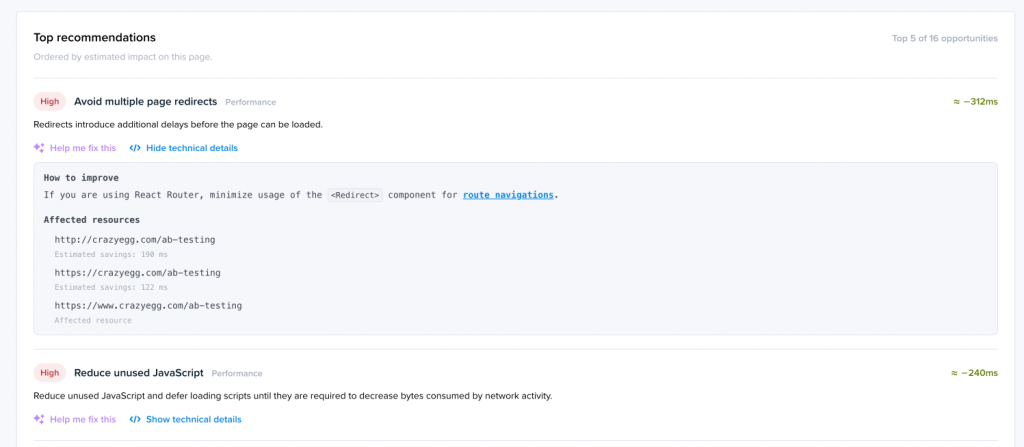
The Top recommendations section highlights up to five Performance improvements that may have the greatest impact on the page.
Depending on the recommendation, Crazy Egg may show:
- The estimated impact.
- The metric or score affected.
- Estimated time savings.
- Estimated file-size savings.
- Affected resources.
- Affected page elements.
- Additional technical details.
Use these recommendations to prioritize changes instead of trying to address every Lighthouse audit at once.
Get AI help with a recommendation
If AI assistance is available on your account, click Help me fix this next to a recommendation.
Crazy Egg can generate page-specific guidance that may include:
- An explanation of the issue.
- Recommended implementation steps.
- Code examples.
- Expected impact.
- Considerations for avoiding regressions.
AI recommendations provide guidance only. Crazy Egg does not automatically modify your website.
Review and test any suggested changes before deploying them to production.
After making a change, run another audit to see how the page’s results changed.
Review all audits
The All audits section contains the complete set of Lighthouse checks collected during the audit.
You can filter the results by:
- Failed
- Errors
- Warnings
- Passed
Expand an audit to see additional information such as:
- Why the check matters.
- Affected resources.
- Affected page elements.
- Technical details.
- Warnings or other findings.
Measurement errors
A measurement error means Lighthouse was unable to complete that particular check.
A measurement error does not necessarily mean that your page failed the check.
Run a new audit
You can manually run a fresh audit after making changes to your website.
To run an audit:
Crazy Egg runs a new desktop and mobile analysis of the page.
Manual audits are limited to one per page every 30 minutes.
Unlike scheduled monitoring, manually running an audit forces Crazy Egg to perform a fresh analysis even when a page change has not been detected.
While the audit is processing, its status may appear as Queued or Running.
If the latest audit cannot be completed, Crazy Egg continues displaying the most recent successful results when available.
Automatic Page Speed monitoring
Crazy Egg automatically checks monitored pages on a recurring schedule.
Depending on your plan, pages are checked daily or weekly.
When Crazy Egg detects that a monitored page has changed, it performs a new audit and saves the results to the page’s audit history.
The report also shows the next scheduled check, so you can see when Crazy Egg plans to check the page again.
Track performance over time
Page Speed keeps previous audit results so you can see how a page changes over time.
Use the Change column to compare the latest Performance score with the previous audit.
This can help you determine whether:
- A recent site change improved performance.
- A deployment introduced a regression.
- Performance is gradually improving or declining.
- An optimization produced the expected result.
For example, after optimizing a large image or removing a blocking script, you can run a new audit and compare the latest result with the previous score.
Because Lighthouse results can vary slightly between runs, focus on meaningful changes and longer-term trends rather than small differences of only a few points.