Welcome to your Scrollmap Report!
When you create a Heatmap, you have access to seven different data reports. The Scrollmap Report can help you determine the ideal landing page length for maximum conversions.
It shows you how far visitors scroll on your most important web pages and where they start to lose interest. This is a helpful insight when figuring out where to place your signup buttons, forms, and other important calls to action. If you would like to experiment with a Scrollmap Report while you wait for yours to populate, check out our demo.
How does a Scrollmap Report work?
You may be tempted to assume that web pages are the most popular at the top of the page and that content gets less popular the further down the page you scroll.
Scrollmaps can tell a different story. How do you visualize the people who stop and then resume scrolling? And what about the content that people zip straight past and never look closely at?
That’s where Crazy Egg Scrollmaps can give you these deeper insights into the real-world behaviour of your website visitors.
Instead of only seeing where people drop off on a page, you can also see what they scroll past, when they resume scrolling, and where they truly start to drop off permanently, so you can optimize your site for effective conversions.
Here are the helpful rules to remember when looking at a Crazy Egg Scrollmap:
- White and red spots: People spent time looking at that section. These are the hot and engaging parts of your page.
- Blue spots: People scrolled past that section or exited the page entirely. These are the cold parts of your page that don’t resonate with your visitors.
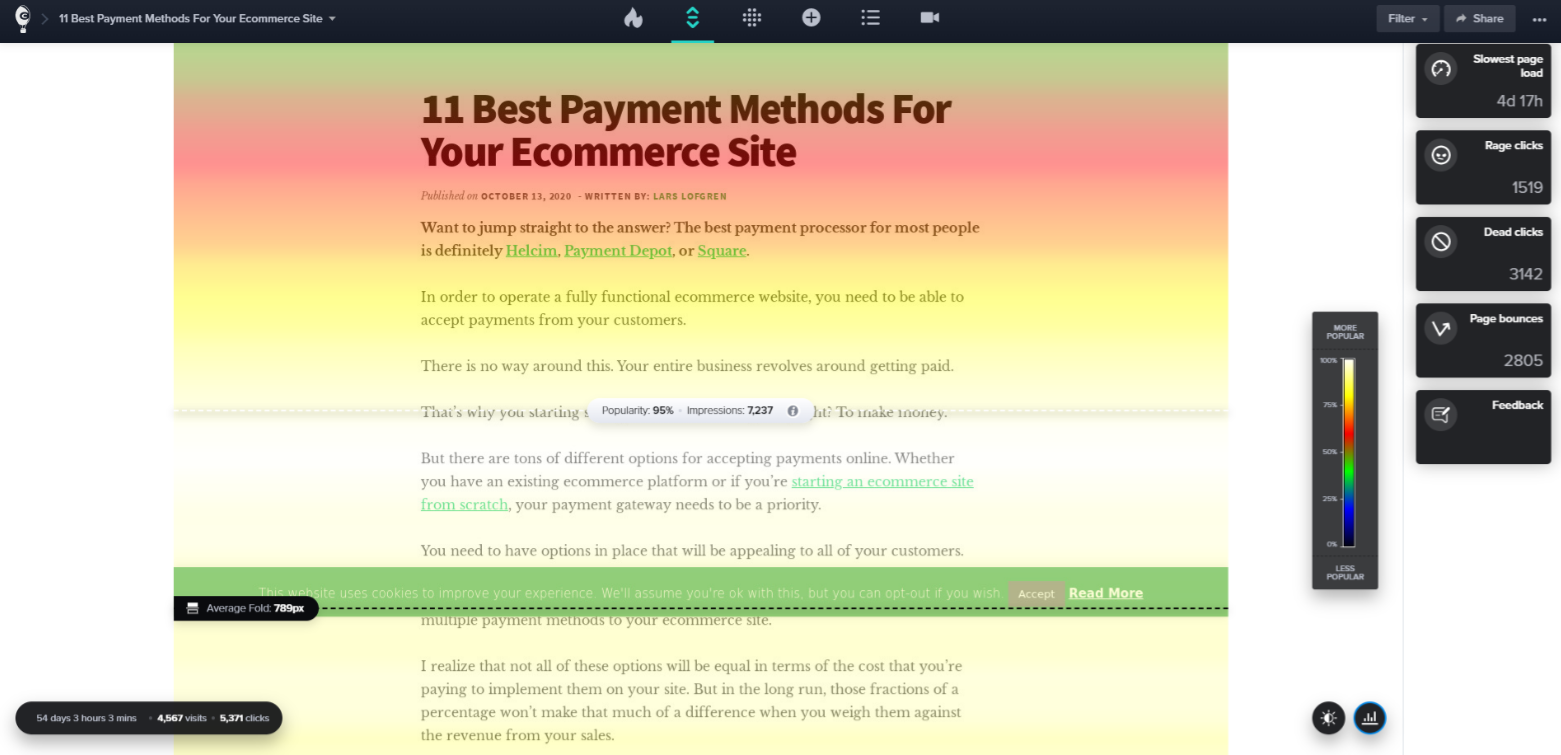
Impressions show which sections of the page are viewed most. A section of the page will receive an impression only if a visitor stops scrolling and the section is in the browser’s viewable area.
If a visitor scrolls past the body of the page and stops at the footer, the body of the page will not receive any impressions but the footer will receive an impression.
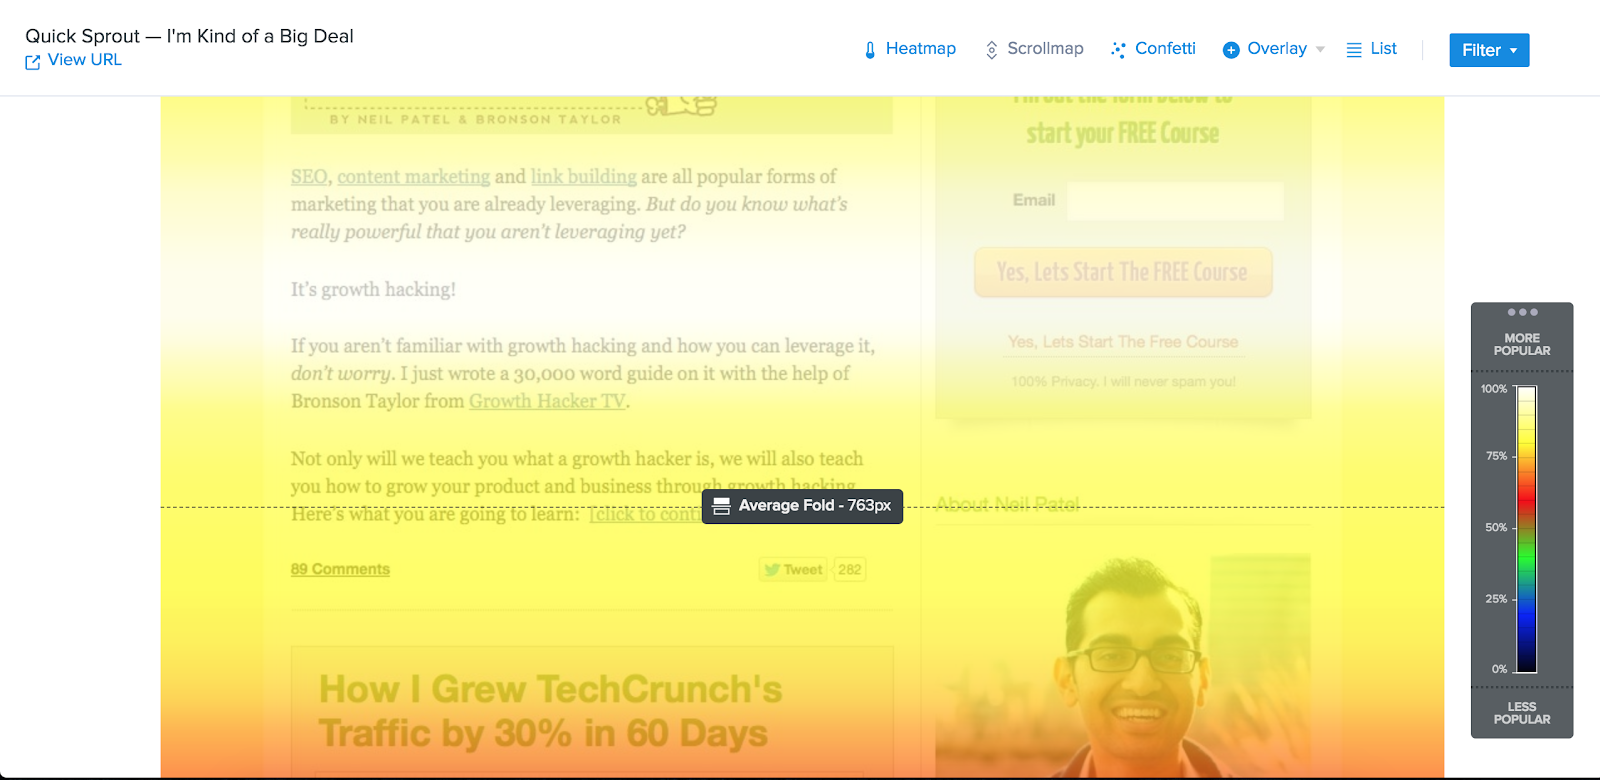
What does the Average Fold mean?
The Average Fold shows what visitors see, on average, in their browser without scrolling.
The Average Fold is accompanied by the exact pixel value. For example, if it says “763px,” it indicates the amount of information shown to visitors on your site before they need to scroll to see more.
This feature shows you how much of your content is immediately visible to your audience. Use this information to adjust your layout so important information appears above the fold. For example, you can place a primary call-to-action above the Average Fold line.
The Crazy Egg Scrollmap also has a hover effect called the “Movable Marker.” The Movable Marker lets you see all the data for impressions on your page.
This feature appears as you move your cursor up and down the Scrollmap Report. The markers indicate the popularity of that area compared to the rest of the page, as well as the exact number of impressions it received. Using this information, you can adjust the page’s content to keep the most important items above the desired viewing percentage. For example, let’s say you have a Buy Now CTA. If the CTA falls below the 50% viewed threshold, you can move it above that section to reach a larger audience.
Additional Reports
If you’d like to learn more about individual clicks, including referral data, this information is available in the Confetti Report. In addition to the Confetti Report and the Scrollmap Report, you also have access to three other reports: Heatmap, Overlay, and List.