Once you’ve identified the pages you want to focus on, and the Snapshots are set up, it’s worthwhile comparing metrics to discover new opportunities for optimization and cross-check your data. When pulling your data from Google Analytics to compare with Crazy Egg, you will want to ensure there are as many similar factors as possible. For example, check if you are looking at the same URL/page and have filtered your data by the device traffic type ( second dimension reporting) specified in your Snapshot. You also want to choose the exact start date as the first date your Snapshot tracked a visit.
From here, you’ll want to look at Pageviews rather than Unique Pageviews in Google Analytics. While the numbers between the platforms won’t match up, the figures should be close since Google Analytics uses a slightly different (guarded) algorithm. Your pageviews’ similarity will also depend on your Snapshot settings and if you have reached your pageviews quota before the month is over.
With these two powerful tools at your disposal, you’re much better situated in your quest to design a better visitor experience on your site!
Impact of GDPR on Volume Tracking
If you have set up your website to suppress any third-party JavaScript from running until your visitor(s) have accepted cookies, then you will possibly see a decrease in volume tracking in both Crazy Egg and Google Analytics if visitors are opt-out or don’t accept.
Suppose this tracking suppression has not been set up correctly, such as suppressing only one script (for example, Crazy Egg and not Google Analytics), or your website suppresses tracking regardless of visitors accepting cookies. In that case, you will see lower volumes of tracked visitors and even a data discrepancy between the two platforms.
My Data Still Doesn’t Match Up
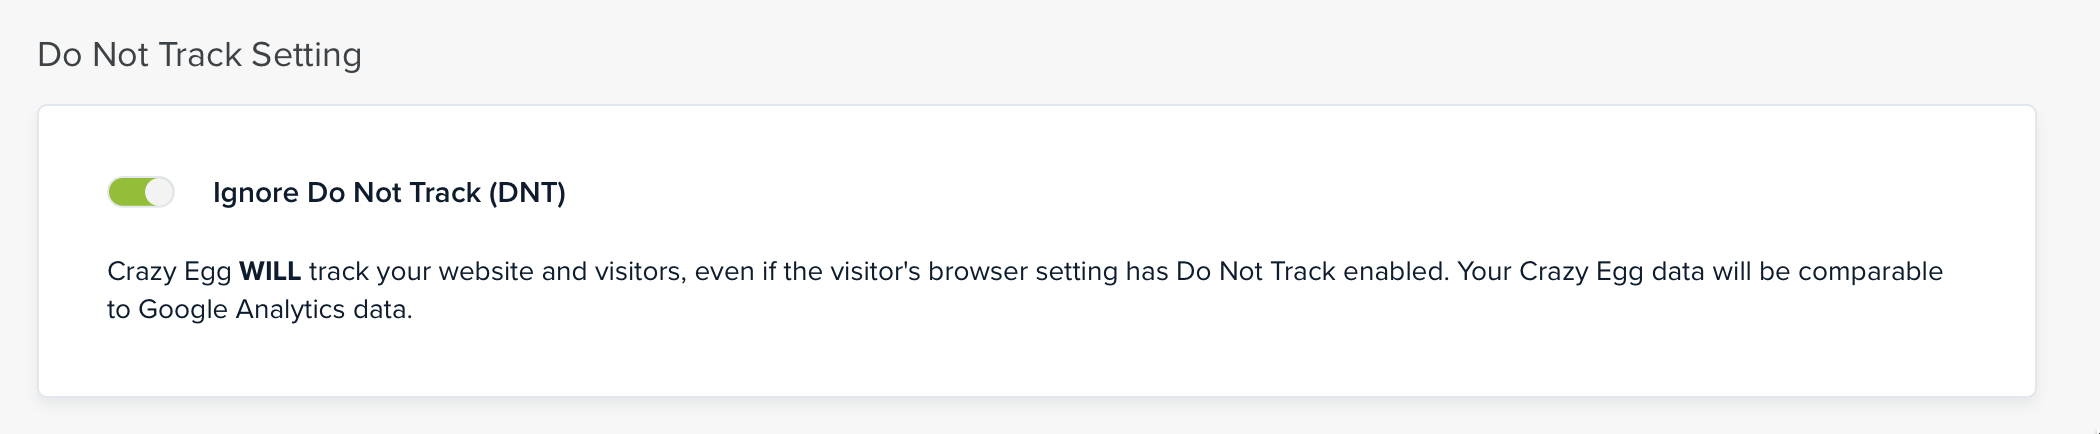
Consider toggling on the Ignore Do Not Track option if your numbers still do not match up. Browsers allow users to set their system to send a Do Not Track message. With this set, by default Crazy Egg will not track these visitors. You can set your Crazy Egg script to ignore this setting and track them anyway.
You can find this setting under Options –> Advanced Tracking (top of the screen).