Funnels give you a structured way to see how visitors move through your most important conversions. This guide walks through creating a Funnel, adding steps, and reading the Funnel data so you can understand performance at a glance.
Open the Funnels Section
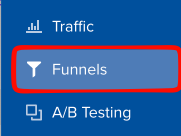
You can create and view Funnels from the main navigation. In the blue menu on the left, select Funnels.
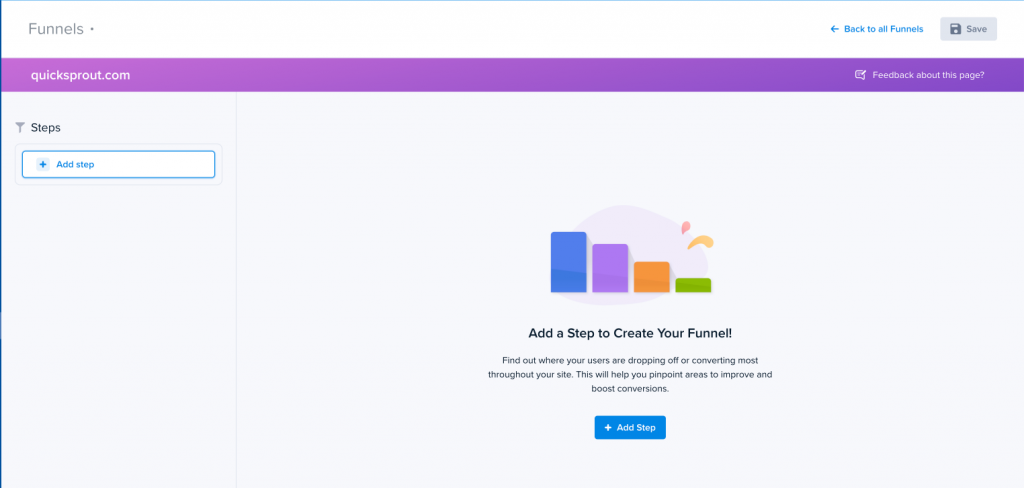
Next, click on Create a Funnel to get started.
A conversion powers each step. If you haven’t set up conversions yet, create those first.
In the Funnel builder, you’ll see a list of your conversions:
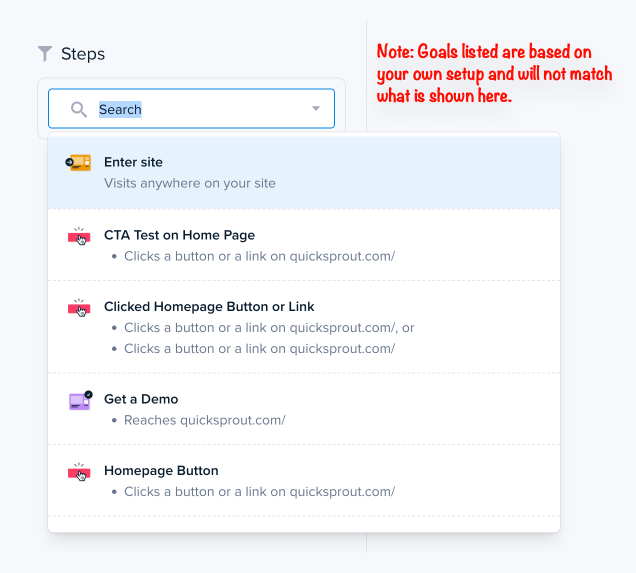
To add a step:
- Click Add Step.
- Select a conversion from the dropdown.
- Arrange steps in the order you want the Funnel to follow (you can drag/drop to rearrange).
- Click Save in the top-right corner.
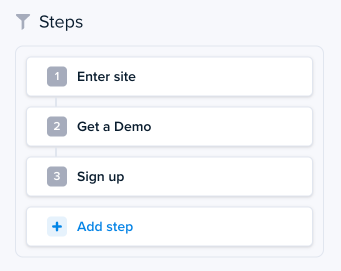
Tip: Start with the broadest conversion (ex: “Enter site”) to get clean, accurate conversion rates.
Note: Once saved, Funnels will automatically update as more visitors trigger the underlying conversions.
Reading Your Funnel Results
When your Funnel report loads, you’ll see:
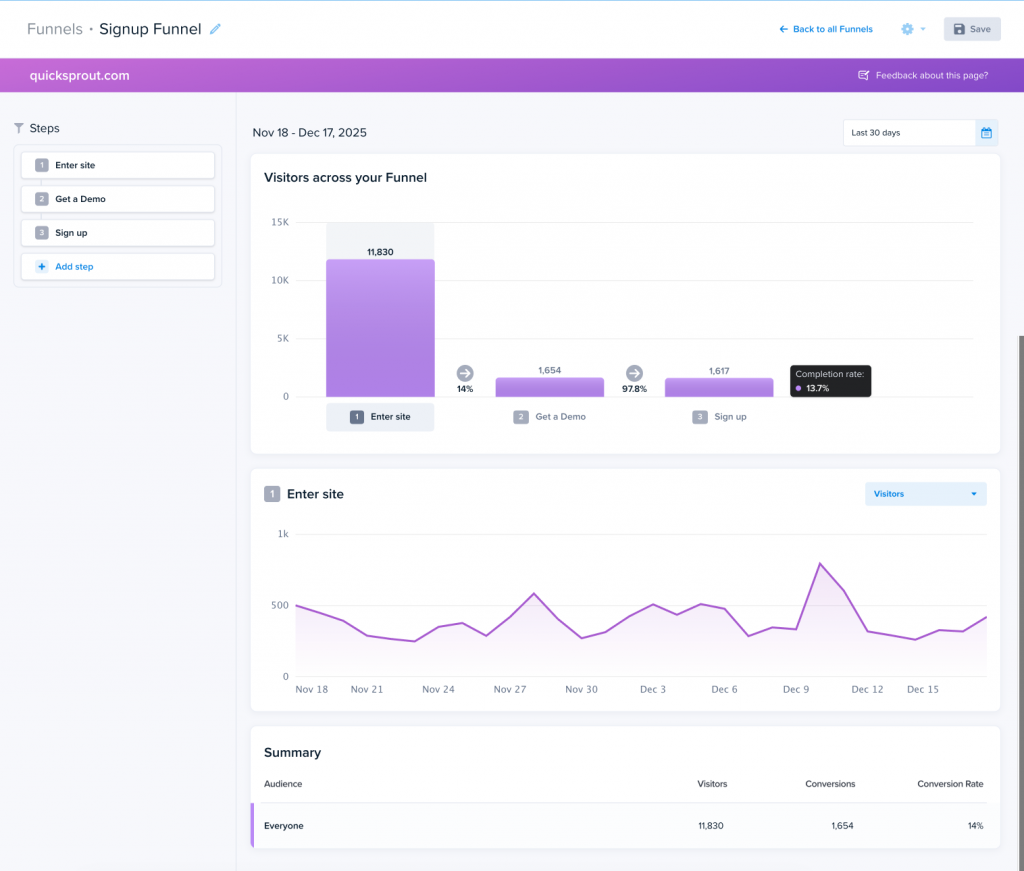
Visitors across your Funnel
A bar chart that shows how many visitors reached each step and how sharply each step drops.
Conversion rate per step
See the percentage of visitors who move from one step to the next.
Completion rate
The percentage of visitors who reach the final step of the entire Funnel.
Trend line for each step
A time-based view that shows whether performance is improving, declining, or stable.
Summary table
A breakdown of visitors, conversions, and conversion rates for the audience you selected.
Improve Your Funnel With Snapshots
Funnels tell you where users drop off.
Snapshots help you understand why.
If a particular step shows a significant drop, consider running:
- A Snapshot heatmap
- A Recording sample
- A scrollmap
- A clickmap comparison with A/B tests
This gives you context about where users hesitate, click, or get stuck — and how to fix it.